Thank you! Your submission has been received!
Oops! Something went wrong while submitting the form.
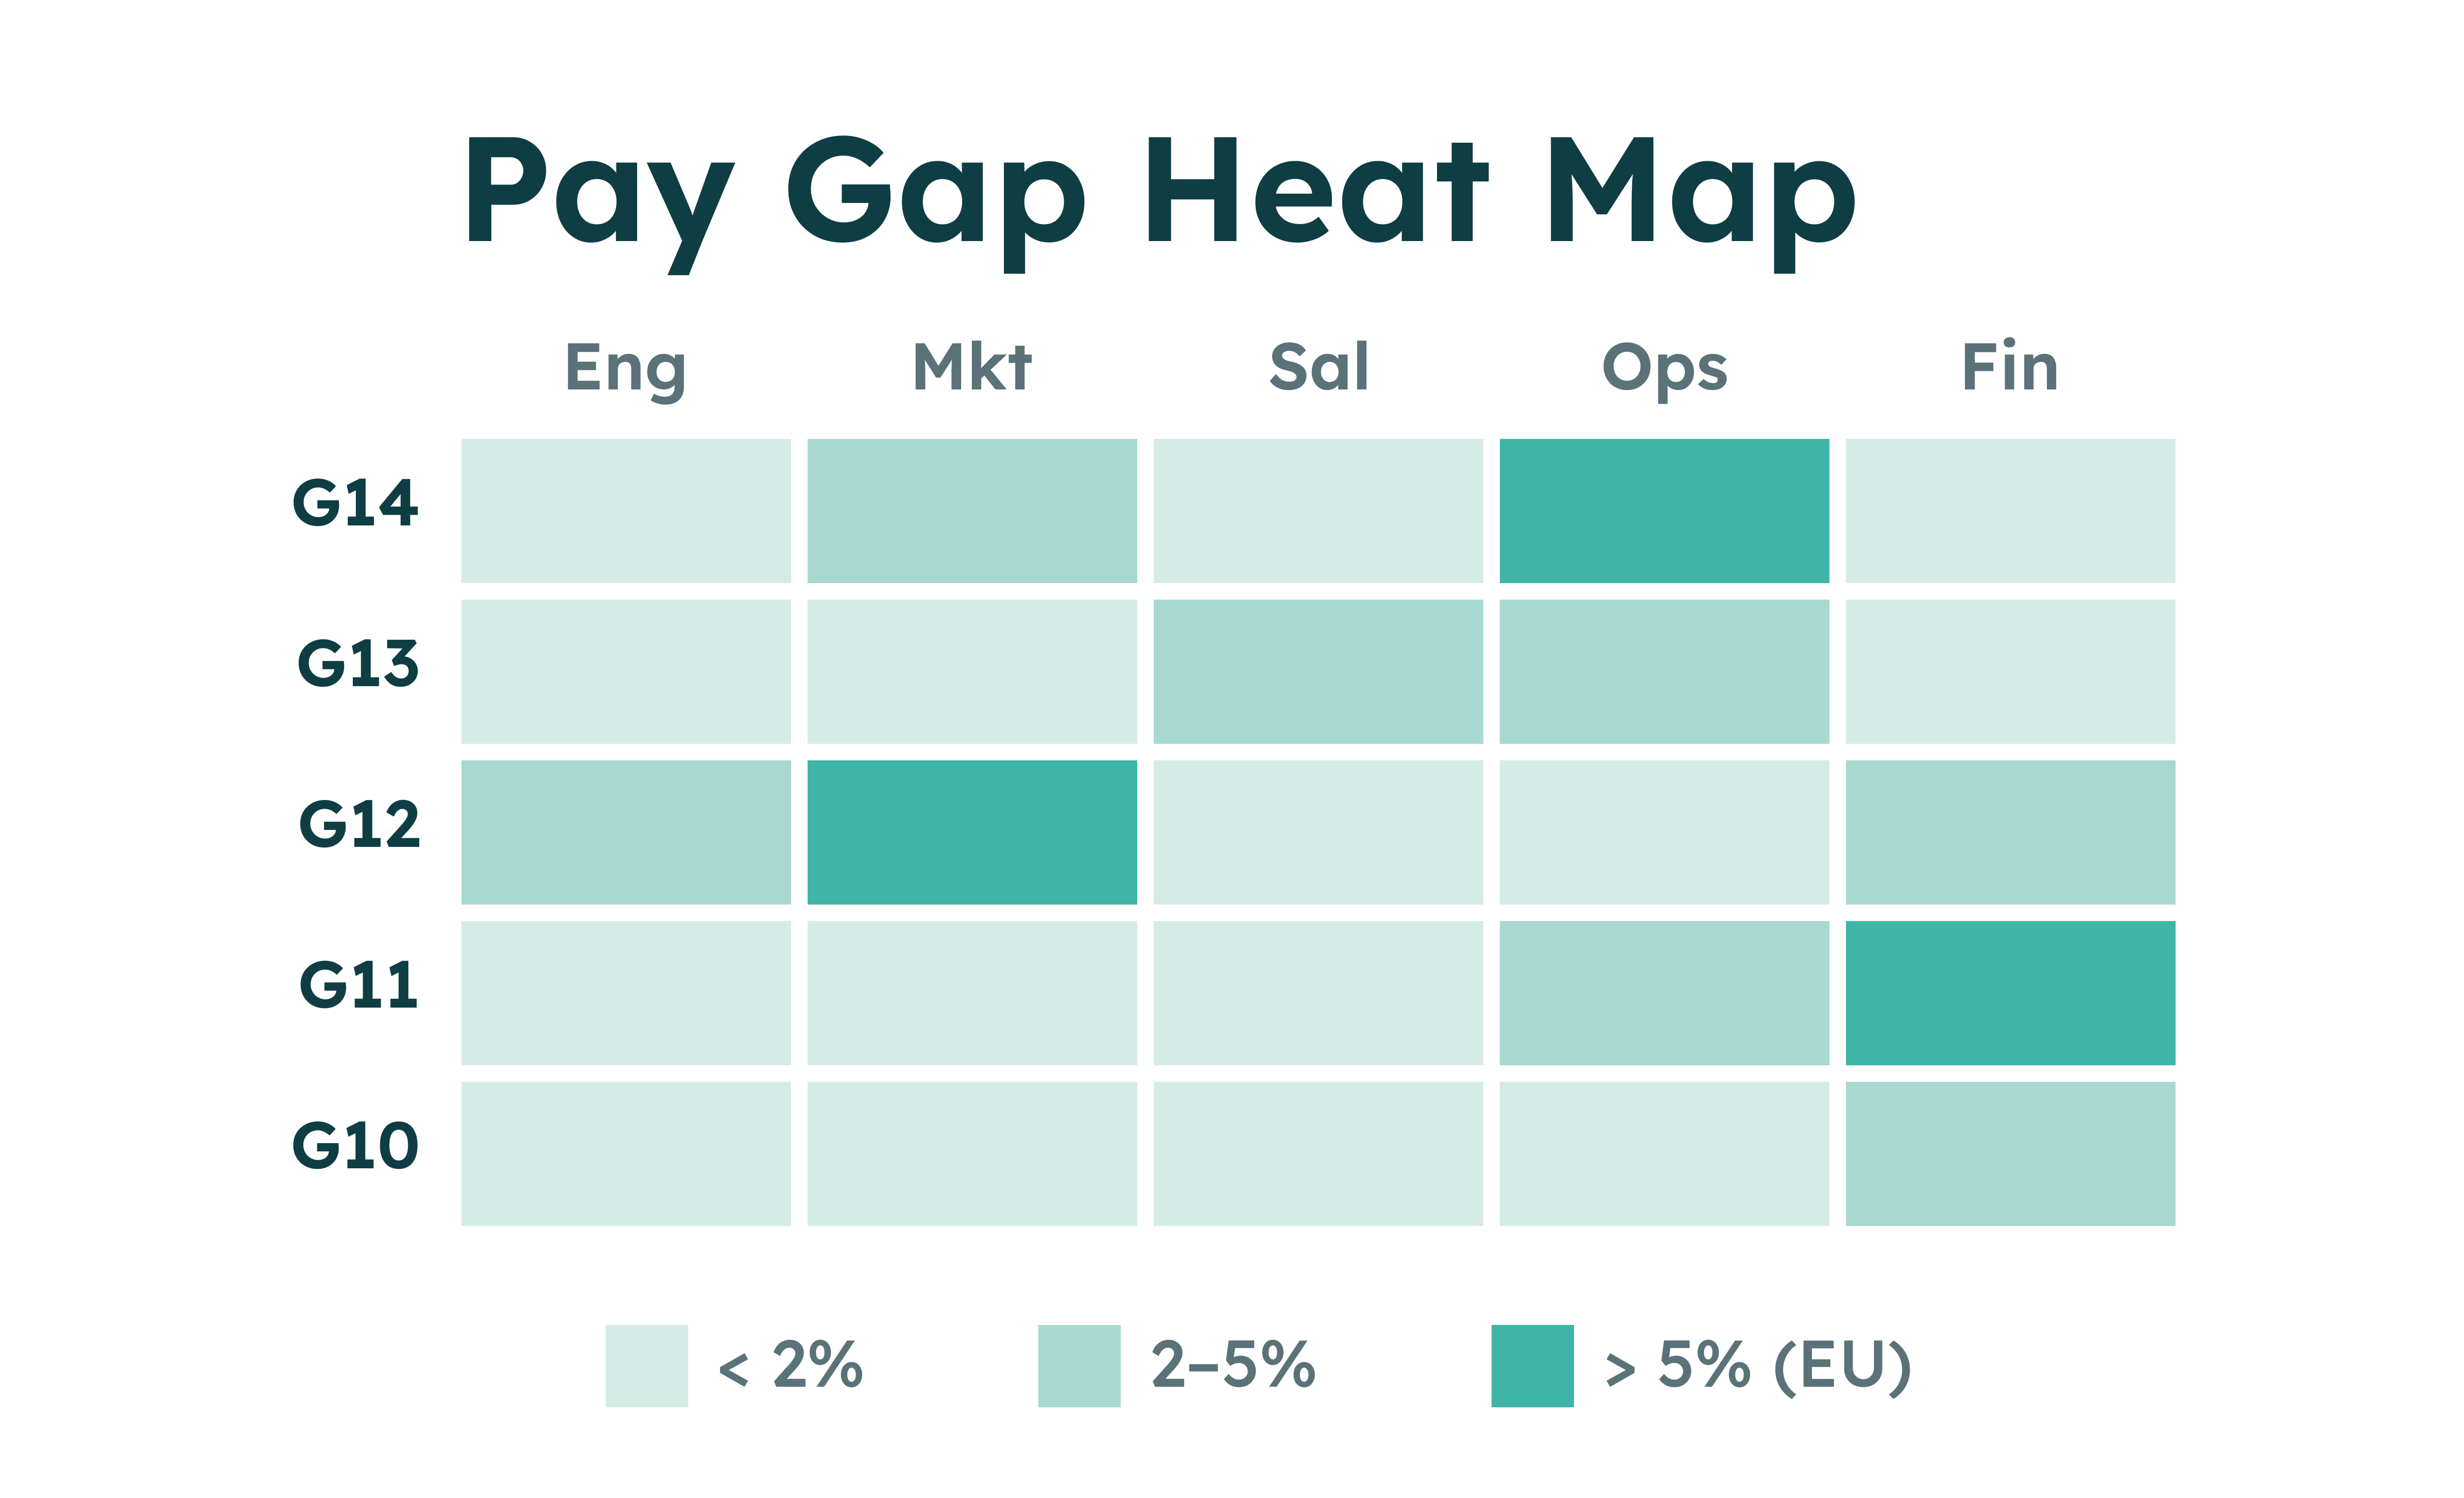
Our heat map provides a clear, visual overview of pay differences across categories of workers – grouped by job grade and job family – highlighting gaps above the EU Pay Transparency Directive’s 5% threshold.


Our heat map shows how pay differences are distributed across the organisation, making it easy to identify where gaps exist and where action may be needed. By presenting results visually, organisations can quickly spot patterns and focus attention on areas that require deeper analysis.
The heat map groups data by job grade (or company-specific level), global job family and other structural dimensions - ensuring pay gaps are analysed in the context of comparable work. This helps organisations evaluate pay differences using consistent job groupings rather than unrelated roles.

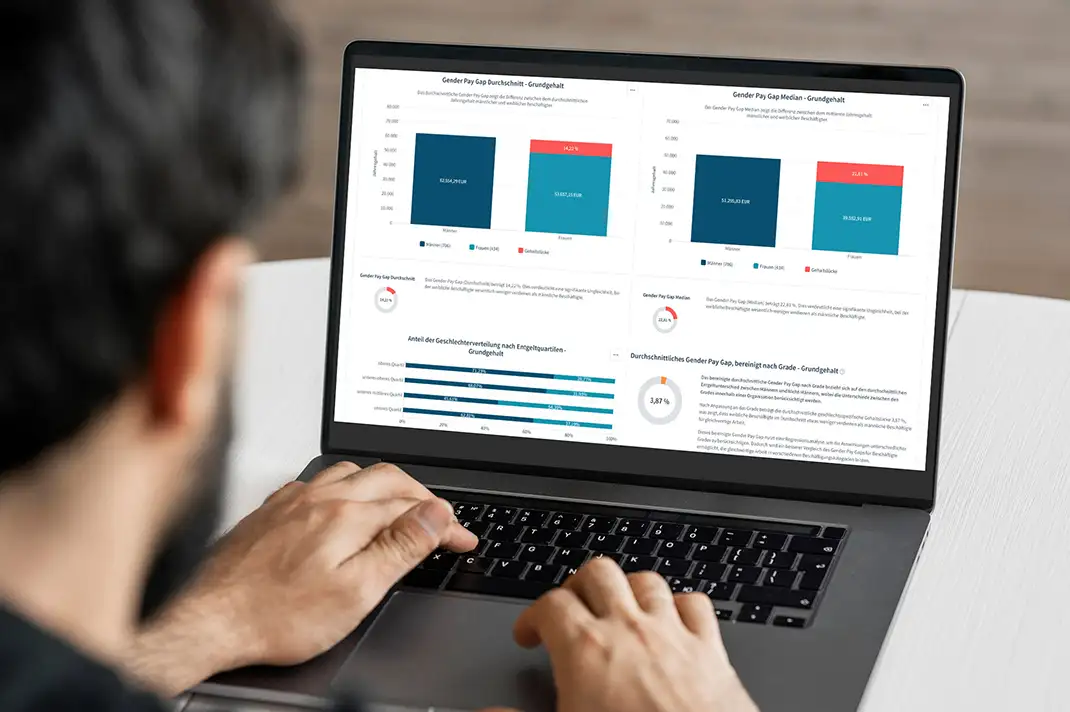
View both unadjusted and adjusted gender pay gaps to understand headline differences and the structural factors behind them. This allows organisations to distinguish between overall pay gaps and those that may remain after accounting for job-related factors.
The heat map highlights pay gaps using clear colour-coding, with gaps above the EU Pay Transparency Directive’s 5% threshold flagged for review. This visual approach helps organisations prioritise investigation and respond more quickly where potential issues may arise.
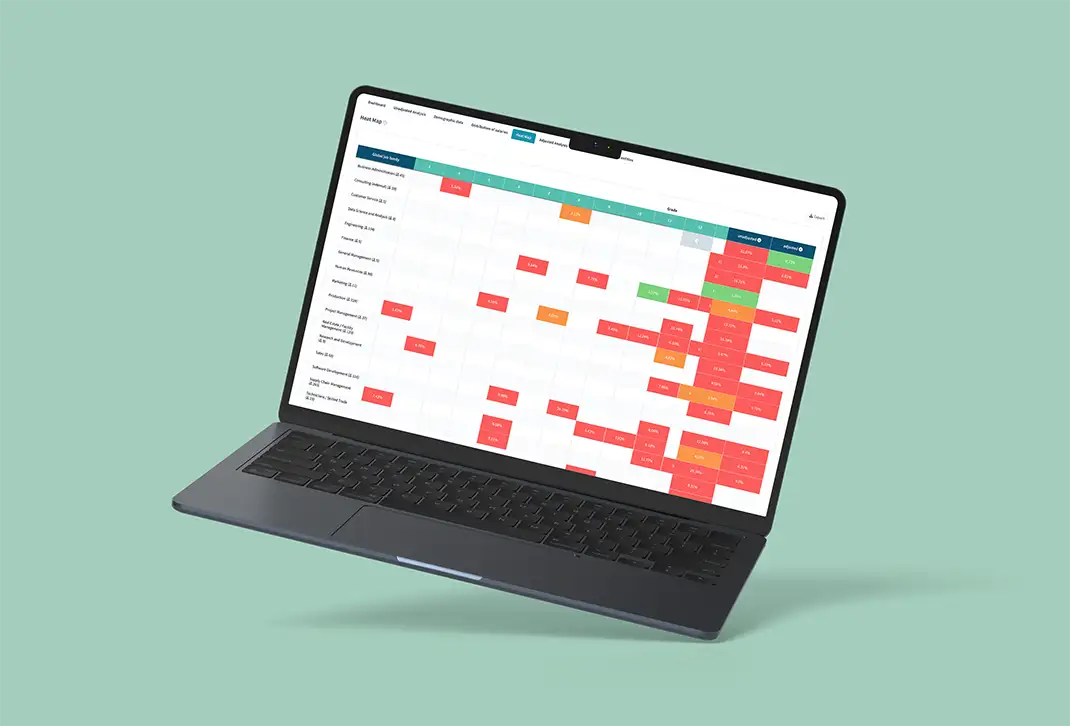

The gender pay gap heat map provides a visual overview of pay differences between men and women across your organisation. It displays how pay gaps are distributed across comparable groups of workers, typically organised by job grade or company-specific level and global job family. This makes it easier to quickly identify where gaps exist and where further analysis may be needed.
The heat map shows the distribution of pay gaps across different role groups within the organisation. Each cell represents a category of workers defined by job structure elements such as job level and job family. The colour of the cell indicates the size of the pay gap within that group, allowing organisations to quickly spot patterns and areas that require closer review.
The unadjusted pay gap shows the overall difference in pay between male and female employees across the organisation or within a defined group. The adjusted pay gap goes one step further by analysing whether differences remain after accounting for job-related factors such as job level, job family or other structural variables. Viewing both helps organisations understand whether gaps are structural or potentially problematic.
The EU Pay Transparency Directive focuses on pay differences within categories of workers performing the same work or work of equal value. gradar’s heat map uses structured job data - such as grades, job families and other comparable groupings - to analyse pay differences within those categories. This supports organisations in identifying situations where the Directive’s 5% threshold may be relevant.
The heat map uses colour-coded indicators to highlight the size of pay gaps. Green typically indicates smaller differences, while orange and red highlight larger gaps that may require further review. Red cells represent gaps above the EU Pay Transparency Directive’s 5% threshold, helping organisations quickly focus attention on areas where investigation may be necessary.
The heat map helps organisations move from raw pay data to actionable insight. By highlighting where gaps appear within comparable groups of workers, HR and reward teams can prioritise analysis, investigate underlying causes and determine whether adjustments or policy changes may be required.
The heat map is built on structured job and employee data within gradar. This typically includes job levels or grades, job families and salary information for employees. Because the analysis is grounded in the organisation’s job architecture, it helps ensure comparisons are made between genuinely comparable roles.
No. A pay gap highlighted in the heat map does not automatically mean discrimination exists. The heat map simply identifies differences in pay that may require further analysis. Organisations still need to review the context, job structure and other objective criteria to understand whether the gap can be explained or whether corrective action is needed.
Reporting, pay equity analysis & gender pay gap tools - all in one place.
Guidelines, directives & best practices for achieving pay transparency.

Use gradar’s gender pay gap heat map for clear, visual insight to support fair outcomes, explain pay differences and meet pay transparency requirements with confidence.
Job evaluation
Compensation
Pay transparency